빅데이터 분석기사 실기!!
요점정리입니다!!
시험전 꼭 알아갈 파이썬 기능!!
함수 메뉴얼은 help!!
import scipy.stats
help(scipy.stats)
어떤 함수가 있는지 모를떄에는 dir!!
import scipy.stats
dir(scipy.stats)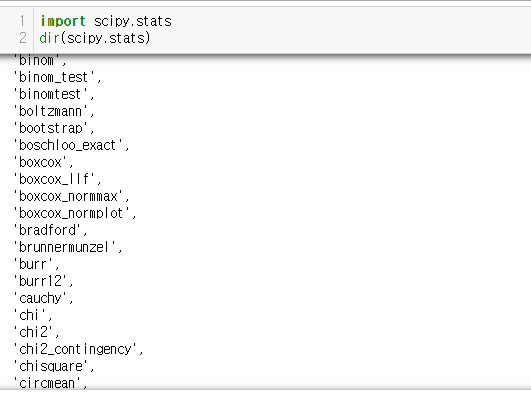
유형1 : 간단한 판다스 사용법 알기.
+ 아래의 기본적인 기능 기억하기
- 1사분위: df['해당컬럼'].quantile(0.25)
- 3사분위: df['해당컬럼'].quantile(0.75)
- 중앙값 : df['해당컬럼'].median()
- 판다스 데이트타임으루 바꾸기 : pd.to_datetime(df['date_added'])
유형2 : 머신러닝작업.
진행방법
1. 결측치 처리 : fillna로 0 이나 mean 값 넣기
2. 변수 만들기 (target 값 컬럼만 뽑기)
3. 레이블 인코딩 : LabelEncoder
4. 데이타 스케일링 : MinMaxScaler
5.데이타 분리 : train_test_split
6. 모델 학습 및 평가 : roc_auc_score
7. 예측
8 결과 제출
# 숫자가 아닌 컬럼들에 대하여 레이블 인코딩하기!!!
from sklearn.preprocessing import LabelEncoder
le = LabelEncoder()
cols = ['주구매상품','주구매지점']
for c in cols:
    X[c] = le.fit_transform(X[c])
	test[c] = le.fit_transform(test[c])
# 민맥스스케일링
from sklearn.preprocessing import MinMaxScaler
scaler = MinMaxScaler()
train['AnnualIncome'] = scaler.fit_transform(train[['AnnualIncome']])
test['AnnualIncome'] = scaler.transform(test[['AnnualIncome']])
# 데이터 분리
from sklearn.model_selection import train_test_split
X_train, X_val, y_train, y_val = train_test_split(train, target, test_size=0.2, random_state=2022)
X_train.shape, X_val.shape, y_train.shape, y_val.shape
## 모델 불러오기
## 모델들
from sklearn.linear_model import LogisticRegression
from sklearn.neighbors import KNeighborsClassifier
from sklearn.tree import DecisionTreeClassifier
from sklearn.ensemble import RandomForestClassifier
from xgboost import XGBClassifier
## 모델 학습하기
## 모델학습 - 의사결정나무
from sklearn.tree import DecisionTreeClassifier
model = DecisionTreeClassifier(random_state=2022)
model.fit(X_train, y_train)
pred = model.predict_proba(X_val)
## 모델학습 - 앙상블
from sklearn.ensemble import RandomForestClassifier
model = RandomForestClassifier(n_estimators=100,max_depth = 5, random_state = 2022)
model.fit(X,y['gender'])
pred = model.predict_proba(X_val)
## 모델학습 - 로지스틱
model = LogisticRegression()
model.fit(X_tr, y_tr)
pred = model.predict_proba(X_val)
## 모델 검증하기
from sklearn.metrics import roc_auc_score
roc_auc_score(y_val, pred[:,1])
유형3 : 풀이용 (가설 검증하기)
>> T-test > 평균비교
from scipy.stats import ttest_1samp, ttest_rel, ttest_ind단일표본 : stats.ttest_1samp
두집단 관계 전후 : stats.ttest_rel
두집단 관계 독립 : stats.ttest_ind
>> 카이제곱 : 기대빈도와 가튼지 확인
from scipy.stats import chisquare, chi2_contingency> 리스트 넣어 비교 : scipy.stats.chisquare
> df 넣기 : chi2_contingency(a[['bp_before','bp_after']],correction=False)
>> F검정 : 두 집단 혹은 세 집단 이상 사이에 산포도 차이
from scipy.stats import f_onewayf_oneway( boy, girl)
위의 검정과정을 거쳐서 p 가 0.05보다 작으면 귀무가설을 기각!!
즉, 결과가 유의미하다!!
이번 글은 https://www.kaggle.com/datasets/agileteam/bigdatacertificationkr
Big Data Certification KR
빅데이터 분석기사 실기 (Python, R tutorial code)
www.kaggle.com
의 기출문제 유형을 바탕으로 작성했습니다!!
감사합니다.
'데이터&AI > 데이터분석' 카테고리의 다른 글
| Twitter(x)의 데이터를 분석해보기 - 1 (feat. python) (1) | 2024.09.03 |
|---|---|
| duckDB를 사용해보기 (feat. 가볍다, 근대 성능은 좋아!!? ) (0) | 2024.08.30 |
| 데이터 분석가를 위한 쉬운 docker : 편리한 notebook 환경 만들기!! (1) | 2024.06.06 |
| Python사용자 입장에서 이해하는 Front-end (with Pandas, React) (0) | 2024.05.24 |
| 빠르고 쉽게 설치하는 AIRFLOW (우분투, 코드 4줄) (0) | 2024.05.22 |


댓글